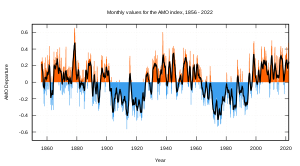
It's an undetrended AMO (Atlantic Multidecadal Oscillation) graph. Normaly, what you get, if you research the AMO on say Wikipedia, is this graphics:
And then you get this definition:
The AMO signal is usually defined from the patterns of SST variability in the North Atlantic once any linear trend has been removed. This detrending is intended to remove the influence of greenhouse gas-induced global warming from the analysis. However, if the global warming signal is significantly non-linear in time (i.e. not just a smooth increase), variations in the forced signal will leak into the AMO definition. Consequently, correlations with the AMO index may alias effects of global warming.
 Ever since I first read this, I have been wondering what the abolished trend would look like. However, it can be time consuming in the extreme to hunt these datasets down, and my first attempts failed, until I saw the term on WUWT: not detrended. - That did the job with Google.
  So let me show you some graphs I've made or collected, which I firmly believe call into question the premis for this somewhat biased procedure. I got myself an undetrended AMO dataset, calculated the anomalies and made comparisons with some other datasets.
First graph shows the difference between the AMO datasets: detrended & undetrended. The detrended dataset obviously have zero trend (yellow) and the undetrended dataset has a trend of 0.4 degrees C. Is this important? Oh, yes: it's extremely important.
 Next graph shows Nasa GISSTemp dataset and the undetrended (what a weird word) AMO anomalies. Normally I would be forced to include a second Y axis, when comparing trends in two very different datasets (One is regional SST, the other global atmosphere). Not in this case though: the intensities match to a tee.
Notice that while the GISS Temp data depart from the AMO around 1970 the UAH data seem a somewhat better fit during this period. Is this coincidental? Not very likely, no... GISS manipulates the data, and the result is very often a warming trend. Click the right handside image to play an animation, which slides between two GISS U.S. temperature anomaly charts:
The first dataset is from 2007 and the second (PDF, Fig. 6) is from 1999. I know of no reasonable argument, which would justify concistently making the past colder and the present warmer. Nevertheless GISS is relentless.

So what's going on? I think it has to do with the fact, that the Atlantic of all the worlds oceans has the only major inlet to the Arctic Ocean; which in the unlikely event, that you did not hear about it, is currently melting it's summer sea ice. In short: it's been warming in the Arctic. Not surprisingly this warming follows the AMO anomaly. Probably the Arctic IS the AMO and by extension 'global' warming caused by the sun. Why is it not co2 warming the Arctic and then warming the Atlantic?
This statement makes the rather absurd assumption, that any AMO SST warming beyond 1 degree must be due to co2. Which is arguably false:This detrending is intended to remove the influence of greenhouse gas-induced global warming from the analysis. However, if the global warming signal is significantly non-linear in time (i.e. not just a smooth increase), variations in the forced signal will leak into the AMO definition. Consequently, correlations with the AMO index may alias effects of global warming.


Greenland is located right where the AMO is most influential. The GISP II icecore data show plenty of natural variation from a time, where co2 never rose above 280 ppm. Al Gore in the film 'An inconvenient truth' uses Vostock (Antarctic) ice core proxies as global indicators of both temperatures and CO2 reaching 700.000 years back into the Pleiocene to show that the two are correlated. Actually, according to the chart on the left (GISP II, Arctic) temperature and co2, throughout the holocene, seem inversely related.
All this being true, it is then either wrong, deceptive or both to argue that virtually any rising SST trend in the North Atlantic region for the last 155 years must be caused by human industri. - I can't stress enough, how genuinely weird that claim is! - It amounts to denial...
 Do we see anything untowards or in any way unusual in the icecore data? The answer must be a very firm: abolutely not! Right up until 1993 there's not a trace of warming, which might not be absolutely natural. Actually the trends for the last one thousand years show a full degree of average cooling and placing the 1940'es in a warmer place than the early 1990'es. - Where have I seen that before...?
But what about the warming since 1780: is it not incredibly unnatural - and to die from? No, it is completely within the bounds of natural variabillity and has been repeated too many times to count throughout the holocene, where at times temperatures were 1,5 degrees C hotter.
As we have seen: since 1993 Arctic temperatures went up by an average degree C. By the same token: at the present rate of decline temperatures could be back to 1993, which also happens to be 1978, levels in 6 years. To top it off: under a global warming scenario, where you have got to detrend the AMO, because it must be under the influence, you would expect the Southern Ocean encircling Antarctica to show some warming as well. It does not:
 It seems to me quite obvious then, that instead of changing sound data, to accomplish nothing but obscuring facts, it is much simpler to assume that the state of the Arctic is generally derived from North Atlantic SST or vice versa, and manifests itself in 'global' temperature products. Both of which coincidentaly follows the phases of solar cycle length rather neatly.
 From the Danish Meterological Institutes survay of glacier melt in east Greenland:
Overordnet viser sedimentkernen, at kælvningen har været stor ikke alene i 00'erne, men også midt i forrige århundrede omkring 30'erne og 40'erne. Det er begge perioder, hvor der også var relativt varmt i både luften og de dybere vandlag samt relativ mindre havis end normalt.
 The text translates to:
Generally the sediment cores show, that calving has been extensive not only in the first decade of 21st century but also in the 30'es and 40'es of the 20th century. Both periods have seen relavtively mild air conditions and warmer subsurface, sea temperatures, as well as less sea ice.Many times on this blog I have also quoted these statements of times passed:
Warming
Arctic Climate Melting Glaciers Faster, Raising Ocean Level, Scientist
Says - “A mysterious warming of the climate is slowly manifesting
itself in the Arctic, engendering a “serious international problem,”
Dr. Hans Ahlmann, noted Swedish geophysicist, said today. - New York
Times, May 30, 1937.
 The
United States and the Soviet Union are mounting large-scale
investigations to determine why the Arctic climate is becoming more
frigid, why parts of the Arctic sea ice have recently become ominously
thicker and whether the extent of that ice cover contributes to the
onset of ice ages.” - New York Times, July 18, 1970
The
United States and the Soviet Union are mounting large-scale
investigations to determine why the Arctic climate is becoming more
frigid, why parts of the Arctic sea ice have recently become ominously
thicker and whether the extent of that ice cover contributes to the
onset of ice ages.” - New York Times, July 18, 1970
Arctic warming has become so dramatic that the North Pole may melt this summer (2008), report scientists studying the effects of climate change in the field. “We’re actually projecting this year that the North Pole may be free of ice for the first time [in history],” David Barber, of the University of Manitoba, told National Geographic News aboard the C.C.G.S. Amundsen, a Canadian research icebreaker. - National Geographic News, June 20, 2008.
 The
United States and the Soviet Union are mounting large-scale
investigations to determine why the Arctic climate is becoming more
frigid, why parts of the Arctic sea ice have recently become ominously
thicker and whether the extent of that ice cover contributes to the
onset of ice ages.” - New York Times, July 18, 1970
The
United States and the Soviet Union are mounting large-scale
investigations to determine why the Arctic climate is becoming more
frigid, why parts of the Arctic sea ice have recently become ominously
thicker and whether the extent of that ice cover contributes to the
onset of ice ages.” - New York Times, July 18, 1970 Arctic warming has become so dramatic that the North Pole may melt this summer (2008), report scientists studying the effects of climate change in the field. “We’re actually projecting this year that the North Pole may be free of ice for the first time [in history],” David Barber, of the University of Manitoba, told National Geographic News aboard the C.C.G.S. Amundsen, a Canadian research icebreaker. - National Geographic News, June 20, 2008.

There is yet another ocean which shares the same latitudes as the North Atlantic, and that would be the North Pacific. As it happens that ocean also undergo drastic climatic change on decadal time scales. This Pacific climate variabillty is reffered to as the PDO:
Updated standardized values for the PDO index, derived as the leading PC of monthly SST anomalies in the North Pacific Ocean, poleward of 20N. The monthly mean global average SST anomalies are removed to separate this pattern of variability from any "global warming" signal that may be present in the data.
In other words: We assume (no argument) that the PDO cannot be the cause of "global warming", so we detrend by subtracting the "global" average mean... This biased top -> down approach eliminates from the outset any possibility that "global warming" could be a regional phenomenon which in time propagates, possibly through both the physical and mathematical universe, to become "global warming". For instance it cannot due to this axiom be assumed, that for reasons as of yet unknown the Atlantic Ocean responds to some aspect of solar cycle properties which modulate Arctic climate in turn influencing the North Pacific.

The graph on the right handside is the result of an experiment: I scaled PDO data to 1/6 and added AMO data. Remember that the PDO is essentially detrended by the global SST mean, which has a rising linear trend, so the PDO/6+AMO is probably too warm in the past and too cold in the present. However, do not fail to concider another likely contributing source to the descrepancy: GISS adjustments. Adjustments have at least two purposes: 1) increase trend to overstate warming and 2) eliminate variation, because models cannot simulate them. This produce two distinct signatures: 1) early datapoints are adjusted negative, late datapoints are adjusted positive and 2) 40'es warm episode and 70'es cold episode are flattened. The second graph on the right is provided from Hansen et al. 1981 (PDF) for comparison.

The graph on the right handside is the result of an experiment: I scaled PDO data to 1/6 and added AMO data. Remember that the PDO is essentially detrended by the global SST mean, which has a rising linear trend, so the PDO/6+AMO is probably too warm in the past and too cold in the present. However, do not fail to concider another likely contributing source to the descrepancy: GISS adjustments. Adjustments have at least two purposes: 1) increase trend to overstate warming and 2) eliminate variation, because models cannot simulate them. This produce two distinct signatures: 1) early datapoints are adjusted negative, late datapoints are adjusted positive and 2) 40'es warm episode and 70'es cold episode are flattened. The second graph on the right is provided from Hansen et al. 1981 (PDF) for comparison.
Bearing all this in mind: the fit to GISSTemp is nevertheless striking. Note: NH is short for Northern Hemisphere.
Curriously specific items can be located in bulk at the same lattitudes as the North Pacific and North Atlantic: the majority of the worlds thermometers. Actual instruments make readings in a local setting, any subsequent manouvers (methods) are nothing but abstractions, which in the end ensures that the 'regions' excibiting variation become 'global' phenomena?
 In information theory we would term the global temperature anomaly products: a loss of information; we loose a lot to gain a little. That 'gain', having little intrinsic scientific value, lies mainly in the message department: clear, simple and visual. Waging an information war with as little information as possible is ironically the sign and predicament of 'the information age' - which started long before the 1980'es: back then it was termed propaganda.
Probability theory will tell you that rolling a die should result in one particular side showing face up every 1 in 6 rolls. However, anyone who actually rolls dice on a regular basis will know, that real dice do not conform to this theoretical prescription. Does that make probability theory useless? No, but you sure as hell better understand its limitation (it's an abstraction) before you walk into a casino with your life savings. Or in the case of the western world: the money you borrowed in China.
 As an aside, the psycological analysis is equally damning: The prophets of doom are vastly more interested in the moral implications than in the scientific ones: When you need to control someone - any righteuos preacher will know this - there's no greater enemy than knowledge and no more effective a tool than guild, which entails the need for payment and sacrifice in order to evade almighty wrath. Organized religion has preyed upon this (insecure) human need for absolution throughout history - it's the precursor of all psycologically incarnated power.
For all our rational and scientific aspirations we fail these concepts misserably: had we any other prospect we would humbly admit to our innermost desires and walk into this religious trap at the very least with our eyes open. But that would spoil the emmotional effect, and we would then emmidiately start looking for a substitute outlet: how to build yet another virtual pyramid on the backs of the poor, while enscribing those scientific tombs with monumental 'rationalisations' concerning our good will towards men - and our oh so selfless desire to save them from themselves.
Per
Ingen kommentarer:
Send en kommentar