From the ancient Ocean rose
Mother Earth and kissed the Sun
Their children grew to reach the sky
Where Father's dying fire
A starry port to heaven blew
So their final breath might reach
The realm of the most High
From the ancient Ocean rose
Mother Earth and kissed the Sun
Their children grew to reach the sky
Where Father's dying fire
A starry port to heaven blew
So their final breath might reach
The realm of the most High
Hykleriet er til at tage og føle på:
https://nyheder.tv2.dk/2022-05-26-rusland-blokerer-adgang-til-politiken-efter-artikler-pa-russisk
Til Politiken siger Christian Jensen, at han ikke er overrasket over blokeringen.
- Det viser, hvor alvorlig en situation vi er i, når et land ikke mener, at dets egen befolkning kan tåle at høre fri og uafhængig journalistik fra andre landes medier, siger han.
Og det har han jo sådan set ret i. Det er bare ærgerligt at han tilsyneladende kun er bekymret om Rusland: prøv fx at tilgå www.rt.com uden en VPN forbindelse.
Det danske riges grundlov
§ 77
Enhver er berettiget til på tryk, i skrift og tale at offentliggøre sine tanker, dog under ansvar for domstolene. Censur og andre forebyggende forholdsregler kan ingensinde påny indføres.
Per
This is a comment to a DW YouTube video:
Speaking of history, so as not to get too one sided here:
The second Polish War (1812):
108.000 polish troops march on Moscow under the command of Napoleon Bonaparte; armies and soldiers from all over Europe join the attack.
Operation Barbarossa (1941):
Army Group South:
The Slovak Expeditionary Army Group (45.000 men)
Royal Hungarian Army Mobile Corps (25.000 men)
Italian Expeditionary Corps (3.000 officers and 59.000 men)
Army Group Antonescu: 3rd and 4th Romanian Armies (325.690 men)
Later added:
14th SS-Volunteer Division "Galician" later renamed 14th Waffen Grenadier Division of the SS (1st Ukrainian)
If Eastern Europe is paranoid over the Russians? well, maybe they should better understand the Russian ditto. One could in particular examine the role of Poland, Lithuania & Ukraine in the recently failed coup in White Russia: Bring up a map of the perished Polish, Lithuanian Commonwealth - and see that involvement in a more... shall we say: historical light?
In 1919, while the Soviet Red Army was still preoccupied with the Russian Civil War of 1917–1922, the Polish Army took most of Lithuania and Belarus [White Russia]. By July 1919, Polish forces had taken control of much of Western Ukraine [Galicia/Volhynia] and had emerged victorious from the Polish–Ukrainian War of November 1918 to July 1919.
History is a guide to human behavior - and whenever you're told only one side of it: it's your God damn job to find out what it is that they prefer that you don't know... especially on German TV!
The human patterns on the Eastern front are very old: compare what's happening now to what happened in 3.000BC to the Yamnaya culture... later to the Cimmerians and then the Goths...
I wrote this in a correspondence on YouTube, thought it covered in a concise way my thinking on the subject of climate change. So I put it here for the record.
Study history: it's evident from the archeological and written records that human migration patterns are roughly consistent and that the type of climate related calamities has been equally so. There are shifts between warm and cold regimes witch change the hydrology patterns on a global scale and hence the grow zones. Humans dependent on a certain survival technique must move according to those zonal shifts in climate.
What is further evident is that geomagnetic shifts relate to those climate shifts. We have magnetite in our brains like the birds and many other species: so at a core level we're programmed to follow certain migration routes when significant change sets in.
I find it particularly fascinating that as the geomagnetic poles are currently moving at a rapid pace China is no longer seen as the promised land of milk and honey for the globalist merchant class: Instead South-east Asia will be shortly.
If you study ancient cultures you will see that they were all subject to this growth and decline pattern. This insight escapes us because the ruling classes always in the end falls back on the tried and tested formula: obey - or your world will end... your TV is your church and the "experts" your priests.


 To the BBC senior scientist Friederikke Otto from Oxford-university Climate research center says, that before the industrial age such a heatwave [in the area of svalbard, east of north Greenland] would have been extremely rare - likely a 1.000 year event.
 It has become a rule by now, that a climate scientist can say anything to the press and get it on print as a matter of truth (They are the priests - sorry, experts, after all). Unfortunately for Friedrikke & Martin reality bears no resemblence to their claims (priests rarely are in touch with reality - but they don't care: they get to eat steak), and it can be quite easily demonstrated.
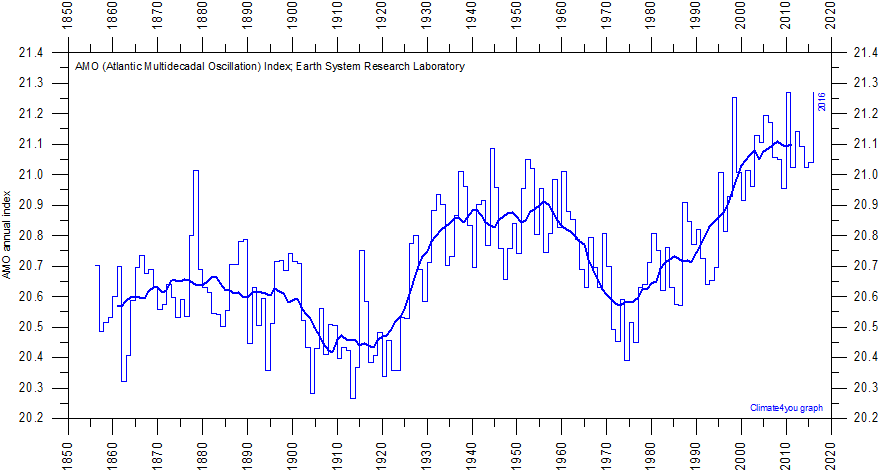
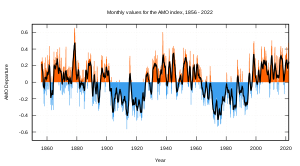
The AMO signal is usually defined from the patterns of SST variability in the North Atlantic once any linear trend has been removed. This detrending is intended to remove the influence of greenhouse gas-induced global warming from the analysis. However, if the global warming signal is significantly non-linear in time (i.e. not just a smooth increase), variations in the forced signal will leak into the AMO definition. Consequently, correlations with the AMO index may alias effects of global warming.
 Ever since I first read this, I have been wondering what the abolished trend would look like. However, it can be time consuming in the extreme to hunt these datasets down, and my first attempts failed, until I saw the term on WUWT: not detrended. - That did the job with Google.
 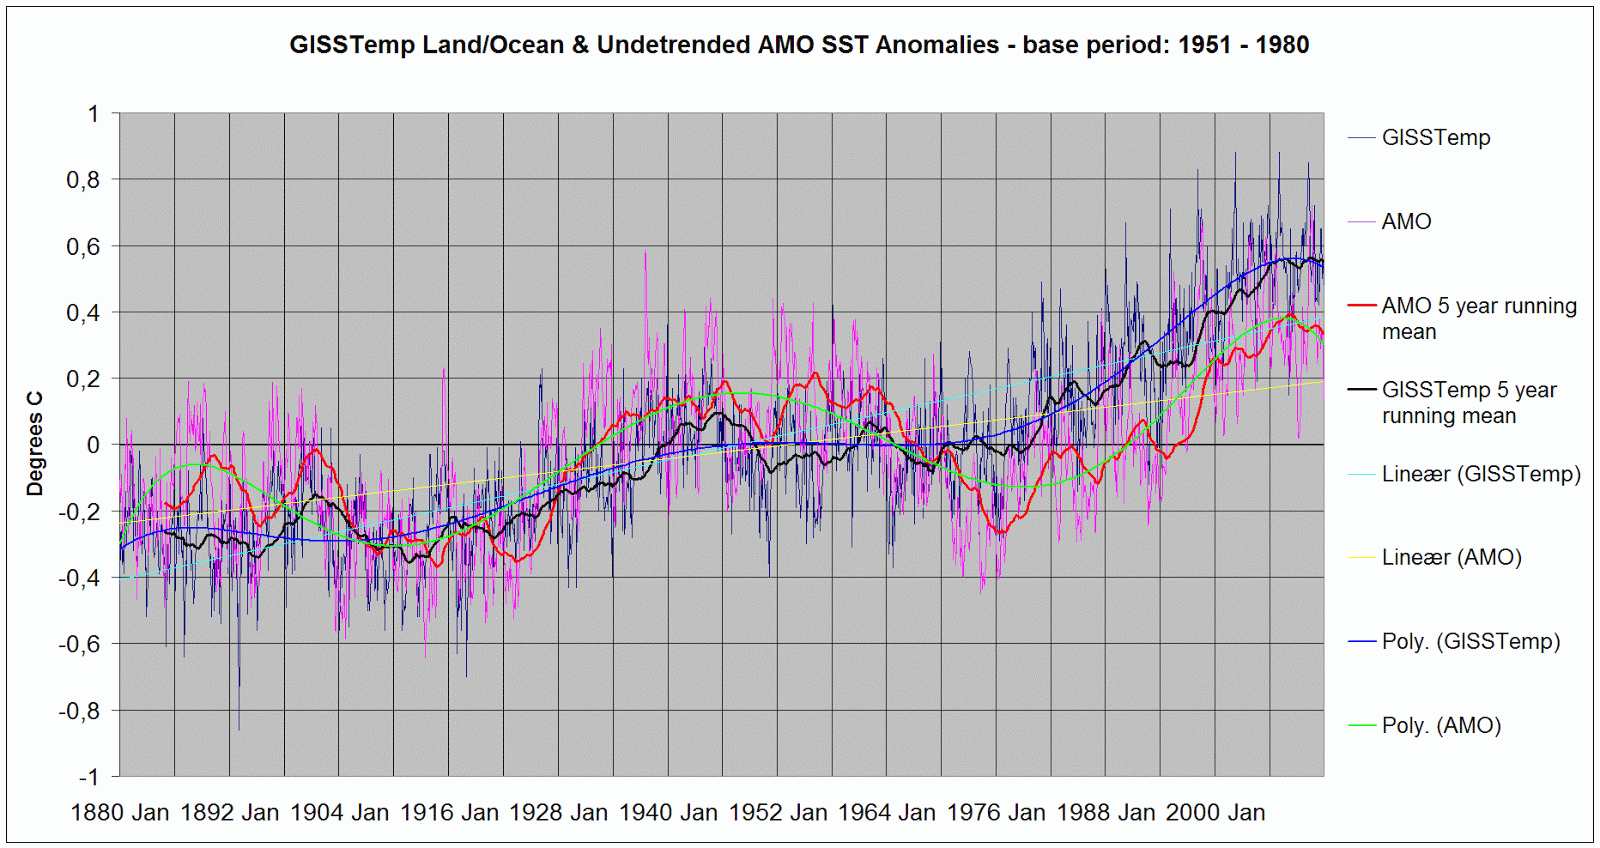 So let me show you some graphs I've made or collected, which I firmly believe call into question the premis for this somewhat biased procedure. I got myself an undetrended AMO dataset, calculated the anomalies and made comparisons with some other datasets.
 Next graph shows Nasa GISSTemp dataset and the undetrended (what a weird word) AMO anomalies. Normally I would be forced to include a second Y axis, when comparing trends in two very different datasets (One is regional SST, the other global atmosphere). Not in this case though: the intensities match to a tee.

This statement makes the rather absurd assumption, that any AMO SST warming beyond 1 degree must be due to co2. Which is arguably false:This detrending is intended to remove the influence of greenhouse gas-induced global warming from the analysis. However, if the global warming signal is significantly non-linear in time (i.e. not just a smooth increase), variations in the forced signal will leak into the AMO definition. Consequently, correlations with the AMO index may alias effects of global warming.

 Do we see anything untowards or in any way unusual in the icecore data? The answer must be a very firm: abolutely not! Right up until 1993 there's not a trace of warming, which might not be absolutely natural. Actually the trends for the last one thousand years show a full degree of average cooling and placing the 1940'es in a warmer place than the early 1990'es. - Where have I seen that before...?
 It seems to me quite obvious then, that instead of changing sound data, to accomplish nothing but obscuring facts, it is much simpler to assume that the state of the Arctic is generally derived from North Atlantic SST or vice versa, and manifests itself in 'global' temperature products. Both of which coincidentaly follows the phases of solar cycle length rather neatly.
 Overordnet viser sedimentkernen, at kælvningen har været stor ikke alene i 00'erne, men også midt i forrige århundrede omkring 30'erne og 40'erne. Det er begge perioder, hvor der også var relativt varmt i både luften og de dybere vandlag samt relativ mindre havis end normalt.
 The text translates to:
Generally the sediment cores show, that calving has been extensive not only in the first decade of 21st century but also in the 30'es and 40'es of the 20th century. Both periods have seen relavtively mild air conditions and warmer subsurface, sea temperatures, as well as less sea ice.Many times on this blog I have also quoted these statements of times passed:
 The
United States and the Soviet Union are mounting large-scale
investigations to determine why the Arctic climate is becoming more
frigid, why parts of the Arctic sea ice have recently become ominously
thicker and whether the extent of that ice cover contributes to the
onset of ice ages.” - New York Times, July 18, 1970
The
United States and the Soviet Union are mounting large-scale
investigations to determine why the Arctic climate is becoming more
frigid, why parts of the Arctic sea ice have recently become ominously
thicker and whether the extent of that ice cover contributes to the
onset of ice ages.” - New York Times, July 18, 1970 
Updated standardized values for the PDO index, derived as the leading PC of monthly SST anomalies in the North Pacific Ocean, poleward of 20N. The monthly mean global average SST anomalies are removed to separate this pattern of variability from any "global warming" signal that may be present in the data.

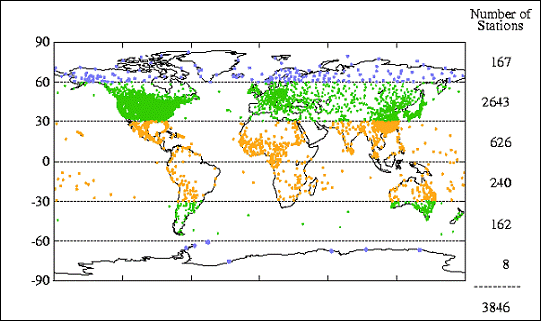 In information theory we would term the global temperature anomaly products: a loss of information; we loose a lot to gain a little. That 'gain', having little intrinsic scientific value, lies mainly in the message department: clear, simple and visual. Waging an information war with as little information as possible is ironically the sign and predicament of 'the information age' - which started long before the 1980'es: back then it was termed propaganda.
 As an aside, the psycological analysis is equally damning: The prophets of doom are vastly more interested in the moral implications than in the scientific ones: When you need to control someone - any righteuos preacher will know this - there's no greater enemy than knowledge and no more effective a tool than guild, which entails the need for payment and sacrifice in order to evade almighty wrath. Organized religion has preyed upon this (insecure) human need for absolution throughout history - it's the precursor of all psycologically incarnated power.


 Today I noticed something for real, which I was probably only dimly aware of - if at all. Maybe it's nothing, maybe it's significant... I don't pretend to know.


 Last year pretty much the same cirkulation (Eastern Siberia & North America heating up) resulted in some 30 cm of snow and -9 degrees for christmas, which is a very rare event here. If this keeps happening - it hasn't been a regular phenomena for 20 years, now - I'll take it as a sign of a cooling North Atlantic in response to the negativ PDO.
 In the state of climate article I showed you this sketch from a National Geographic article from the mid 70's (I don't trust the modern products all too much, so it's nice with some counterbalance from a time, when people still had respect for 'objective' science).


 As the pole heats up due to the warmer waters arriving in the region (forced by solar insolation in the tropics and possibly modulated by cloud and galactic cosmic rays), convective expansion pushes cold airmasses to the south over the continents (colder winters warmer summers in the interior). Eventually the cooler drier northern airmasses reaches tropical waters as they move south east where they fascilitate an enhanced Hadley circulation and upwelling regime. The northern warming cools the southern regions. As the south gets colder so, eventualy, do the hot waters which are pushed to the poles at the western plate boundaries. Eventually the north cools. Possibly solar forcing and magnetic fields (both the Suns and the Earths) modulate the polar atmosphere in various ways: cloud, moisture, temps.
 The danish meterological institute has a Java animation (Bottom of the page) simulating atmospheric circulation for the next week. Running this regularly, you can study the high pressure migration, and the thermal expansion (low pressure) areas and the interaction between them.
 When we look at solar cycle length, it would seem that the recent warming in the 90's was somewhat stronger than the warming in the 30's. However, the present solar cycle lengths should provide a strong cooling effect... all in all we will probably be somewhere near 70's temperatures in roughly 25 years - somewhere around 2035. A cycle length of 60 years. By then we should have a good grasp on what the real effect of co2 looks like.
Solen varsler et kaldere tiår
Jan-Erik Solheim, professor (emeritus) ved Institutt for teoretisk astrofysikk, Universitetet i Oslo, har forsket på sammenhengen mellom solflekkperioder og temperaturer i Norge. Denne forskningen er et originalt arbeide som først publiseres i Astronomi.
Jo lenger en solflekkperiode varer, jo lavere er middeltemperaturen for utvalgte steder i Norge i den neste perioden. Det viser beregninger utført av norsk astrofysiker, som varsler om et kaldere tiår.
Av Jan-Erik Solheim
I was wondering if this supposed correlation would show up on the global scale. So to put this theory to the test, we quite simply plot a graph with the previous cycle length value at each cycle end. To follow the intuitive perception, that the curve should rise and fall with temperatures I inversed the Y-Axis scale, so that the higher the value of the cycle length the lower the curve will go and vice versa. That method should reflect the logic of the argument as I percieve it. I then plotted that graph and the GISS mean global anomalous temperature dataset and added some trend lines.

 While concidering the implications of the graphics, please also review the following reportings of the past:
 And then again 38 years later:
  The Arctic has a natural habbit of warming up and cooling down on a decadal timescale, as global temperatures rise and fall. That is: it rises and falls conciderably in the real world, but in a certain branch of climate science it never happened.
 Now, I realise, that science must change it's paradigms once in a while, that just comes with the territory, but I think it evident, that some in our case have gone above and beyond the call of duty. It's the interpretation of data, not the manipulation of data, which should seed new paradigms. But it is - I think - important, that we all realise how tempting it can be to nutch the whole thing a little, so that you can have it your way. This is after all the reason, that we lie: to have it our way. Deception (PDF) is the gray area of our minds, once you venture there, you might find yourself lost, and trapped, inducing a pseudo state of paranoid psychosis: transforming 'abominal' perceptions to fit the concieved 'reality':
 On the one hand, as scientists we are ethically bound to the scientific method, in effect promising to tell the truth, the whole truth, and nothing but – which means that we must include all doubts, the caveats, the ifs, ands and buts. On the other hand, we are not just scientists but human beings as well. And like most people we'd like to see the world a better place, which in this context translates into our working to reduce the risk of potentially disastrous climate change. To do that we need to get some broad based support, to capture the public's imagination. That, of course, means getting loads of media coverage. So we have to offer up scary scenarios, make simplified, dramatic statements, and make little mention of any doubts we might have. This "double ethical bind" we frequently find ourselves in cannot be solved by any formula. Each of us has to decide what the right balance is between being effective and being honest. I hope that means being both.
 May 8, 2009 -- Solar Cycle 24 Prediction Update The Solar Cycle 24 Prediction Panel has reached a consensus decision on the prediction of the next solar cycle (Cycle 24). First, the panel has agreed that solar minimum occurred in December, 2008. This still qualifies as a prediction since the smoothed sunspot number is only valid through September, 2008. The panel has decided that the next solar cycle will be below average in intensity, with a maximum sunspot number of 90. Given the predicted date of solar minimum and the predicted maximum intensity, solar maximum is now expected to occur in May, 2013. Note, this is a consensus opinion, not a unanimous decision. A supermajority of the panel did agree to this prediction .
Dec. 21, 2006: Evidence is mounting: the next solar cycle is going to be a big one.
Solar cycle 24, due to peak in 2010 or 2011 "looks like its going to be one of the most intense cycles since record-keeping began almost 400 years ago," says solar physicist David Hathaway of the Marshall Space Flight Center. He and colleague Robert Wilson presented this conclusion last week at the American Geophysical Union meeting in San Francisco .


 Following the logic through, this in turn ought to weaken zonal transport dictating the volume of equatorial waters transported to the north at the plate boundaries in the west, as well as the volume of upwelling at the eastern boundaries. All of these schematics produce the net effect of conserving both mass and energy in the tropics, as well as reduce cooling from the upwelling sites. As the polar regions now receive less mass/energy the pressure in turn rises, and the heat in the tropics serve to lower the pressure, producing conditions of the opposite sign. As conditions reverse the polar regions again heat up and the tropics cool.

 They all show cooling, except for region 4, which has recovered quite a bit since the La Nina 2007 - 2008. As the graf to the left will show you, the cooling is highest in the east in the Nino 1 & 2 regions - by a full average degree.


